Data processing
dBTrait is a high-performance software program for the post-processing of acoustic, vibration and meteorological data gathered using the following 01dB data collection systems: DUO, FUSION, CUBE, ORION and dB4 associated with dBTrig.
Features
New 2020 – Always keep an eye on noise sources
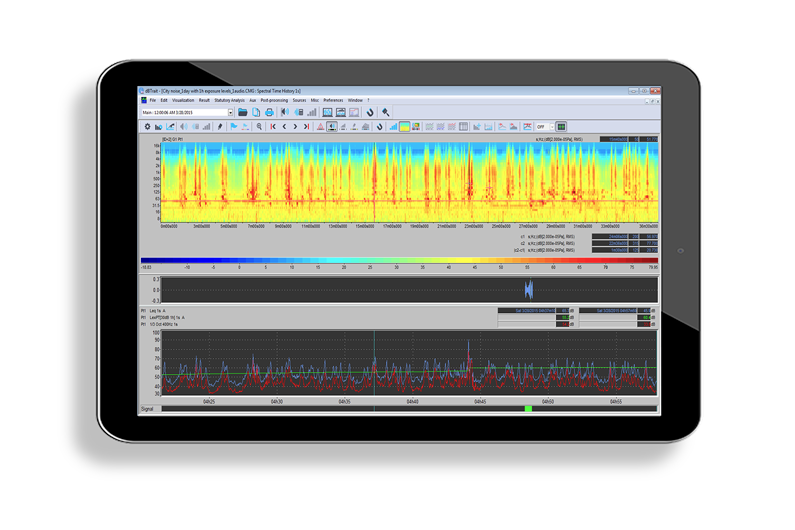
The new 2020 version of dBTrait now includes the full synchronization of the video recording with the time and multi spectrum histories. The easiest way to identify noise sources and markes your measurements.
dBTrait also includes standard calculations in accordance with ISO 2631-2:1989 and ISO 2631-2:2003, and can work with the following indicators:
- Aw(k): weighted rms acceleration per axis (k)
- AwPeak(k): weighted peak acceleration per axis (k)
- AvTj: weighted acceleration of the three axes combined
- A*Tj(k): recomposed acceleration between ⅓ octave F1 and ⅓ octave F2, per axis (k)
- Weighted rms acceleration ⅓ octave spectrum, per axis (k)
")

For experts
While simplicity and productivity are at the heart of dBTrait, it is also important to satisfy our expert clients. That’s why we added advanced features:
- Post-processing: Use of multiple scripts
- Pre-processing on time signals: possibility to use several scripts in order to chain processing
- ORION’s speed signal post-processing
- Configuring post-processing can be saved as an * .ini file
- Open Google Maps to view the GPS coordinates of your device
Training and Information
dBTrait notifies you with each new update so that you can always keep up with new features. In addition, a new menu allows you to access tutorial videos to always be trained.


Viewer mode
For those who do not need all the advanced features of dBTrait, 01dB offers free version VIEWER. It allows you to use certain features like the display of time evolution. A good way to experience the power of dBTrait at a lower cost.
Features
dBTrait includes all functions required for data processing:
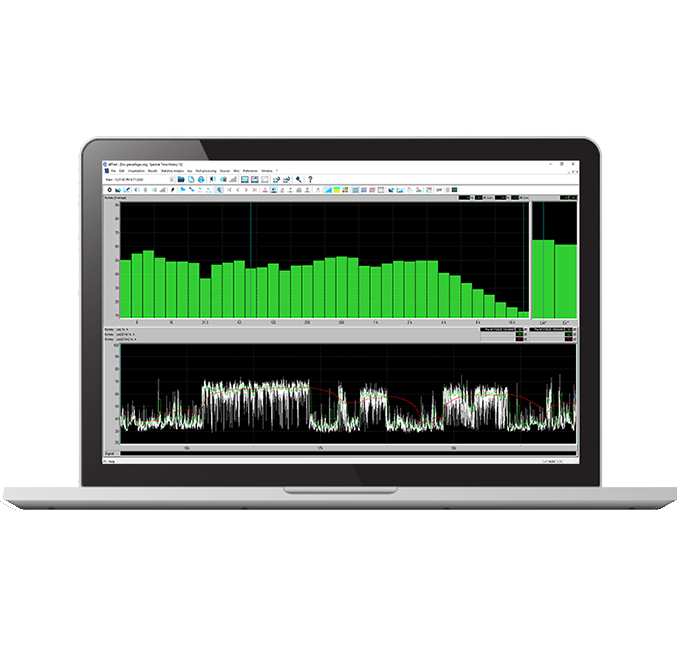
- Multi-curve display of trends in global and spectral indicators over time
- Display of regulatory templates
- Calculation of mean indicators: Leq over period, Lden
- statistical calculation: per source, per period, etc.
- analysis of metrological signals: replay, 1/N octave, FFT, short Leq, etc.
- manual coding, on threshold, crossed between channels
- display of measurement sites on Googlemaps
- export to Word and Excel
Combined with the 01dB WebMonitoring service offer, dBTrait provides customers with an accurate analysis of raw data (available by FTP transfer) in addition to the information available on the project web site.
Downloads
Other products
[related_products title=”Nos autres produits” button_url=”/nos-produits” button_txt=”Tous nos produits”]